 IELTS Max Luyện thi IELTS cam kết đầu ra
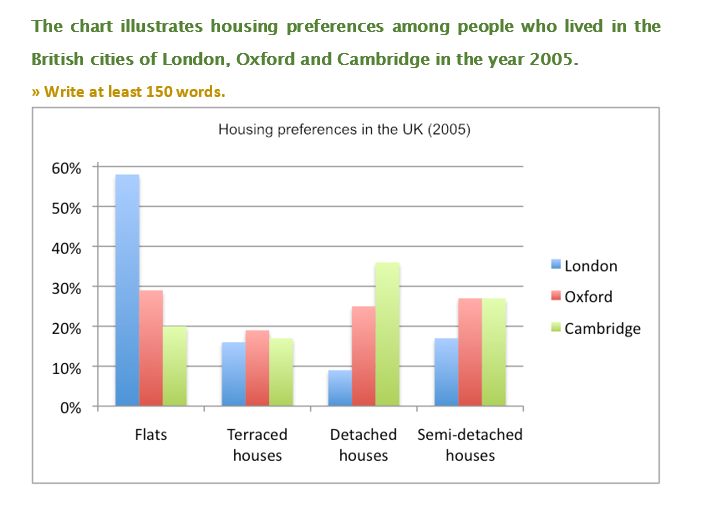
Trang chủ / [TASK 1: Bar chart] The chart illustrates housing preferences among people who lived in the British cities of London, Oxford and Cambridge in the year 2005 / 1
Bài viết liên quan


Có thể bạn quan tâm

Cô Thu Huyền, 9.0 IELTS Reading, 8.0 IELTS Listening
– Chứng chỉ 9.0 IELTS Reading, 8.0 IELTS Listening – Kinh nghiệm giảng dạy: 2 …